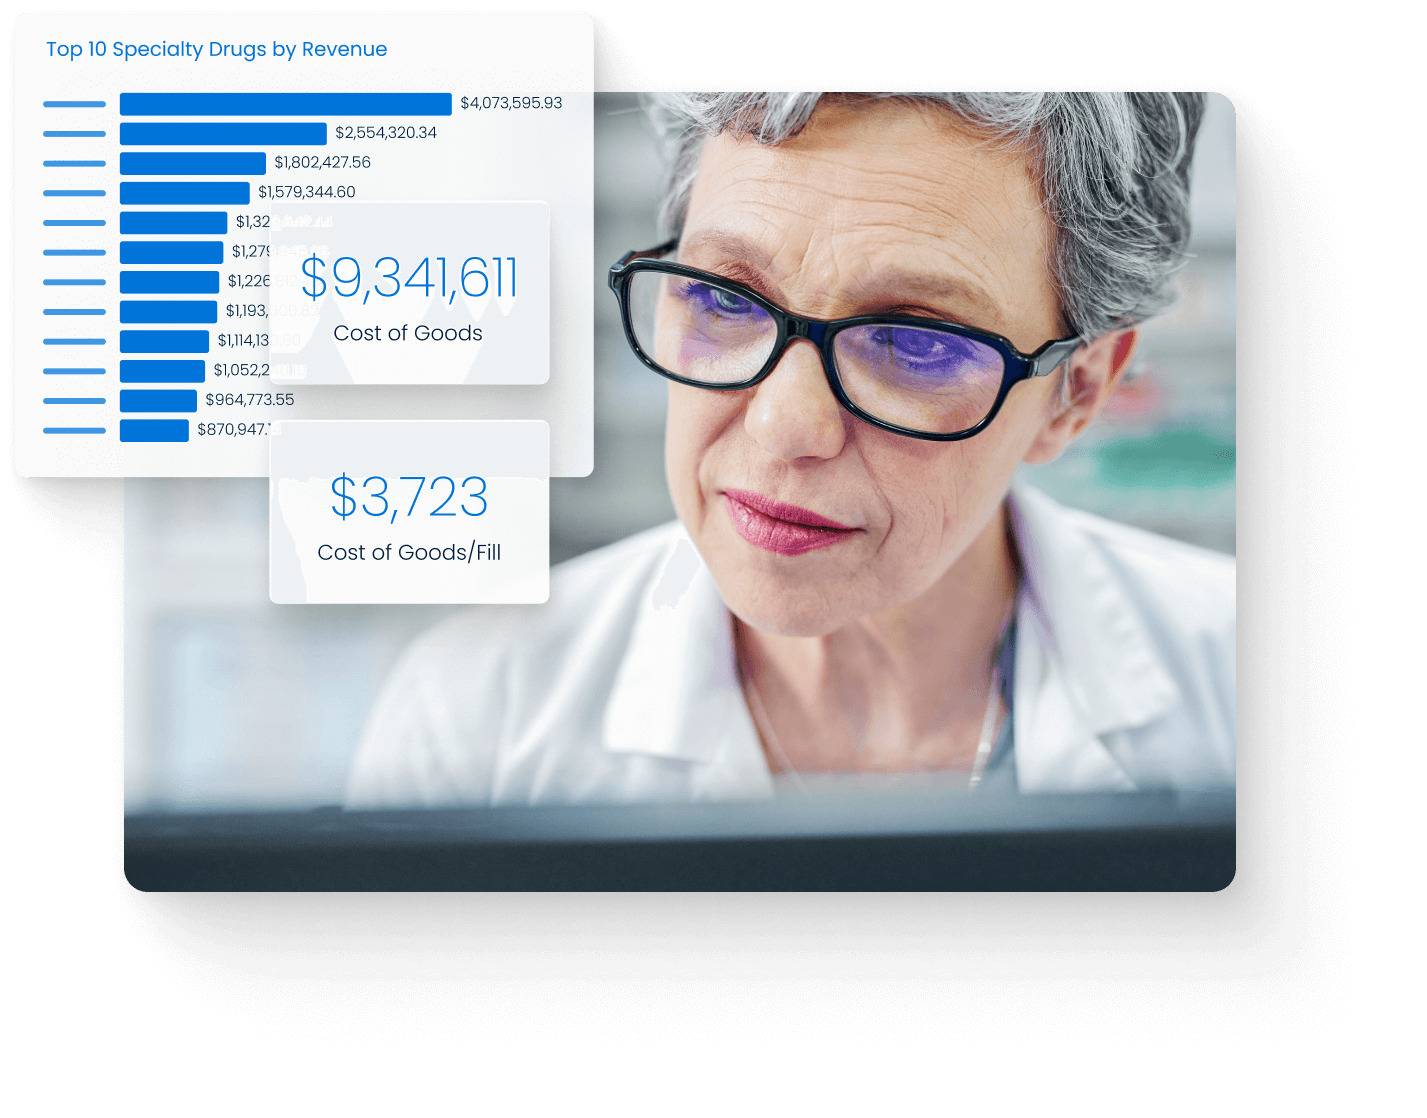
Successfully run your pharmacy with at-a-glance performance reports
With TherigyVista, you can easily review your pharmacy's performance across financial metrics, including revenue, cost of goods, and margin and compare them year over year, month over month, or daily average.